Fill-in the details.

Power BI | MS-SQL | ETL with SSIS | VBA | Python
Advanced Excel | MIS Reporting | Power Query
VB Programming | VBA | MS-Office Automation
Power BI | Power Pivot | Power Query | Basic DAX
Advanced Excel | MIS Reporting | Model Building
end-to-end power reporting.
6 Data Tools | 9 Specialist Certificates | 45+ Projects | View Schedule
Power BI | DAX | MS-SQL | ETL | VBA | Python View Schedule
Power BI
Adv. DAX
MS-SQL
ETL with SSIS
VBA
Python
MASTER
Data Analytics, Advanced Reporting,
Programming & Automation.
Using the right and hybrid technology for advanced BI reporting.
Excel is to BI what wireframing is to application development. Brush up your Excel skills with 60+ formulas, pivots, charts & dashboards to quickly build a POC with small data before investing your time in building complex BI reports with big datasets.
You need not be an expert in Excel, but it does come in handy to be proficient in Excel as it is estimated that 80% of data scientist's time is spent cleaning and preparing data - which becomes a cakewalk with Excel.
You can consider Excel more or less as the foundation to Power BI.
Getting started with Power BI is simple. Then, once you want to leverage its full potential, you need a different set of skills. Learn how to develop these skills, unlock more insights through better data analysis and visualization with this section.
Besides all technical reasons, It is everywhere - Power BI is a leader in Gartner's Magic Quadrant for Analytics and Business Intelligence Platforms.
There is a reason it's called "Power" BI - An incredibly powerful tool for both modeling and visualizing data. It has the same base as Power Query.
As an Analyst, you would find Microsoft Power BI to be a fantastic tool that can handle most of the analytics pipeline. It goes from ingesting and modeling data to presenting it as dashboards and sharing the dashboards with the people who care about them.
Add analytical power to your Power BI model that is not available in the data as-is, using DAX. The goal of this section is to teach you basic to advance features of DAX, providing the knowledge to write formulas for common and advanced business scenarios.
DAX is used in several Microsoft Products such as Microsoft Power BI, Microsoft Analysis Services and Microsoft Power Pivot for Excel. These products all share the same internal engine, called Tabular/Vertipaq (xVelocity before).
With DAX you have the ability to include business logic in calculations in order to enrich your business intelligence models.
During this section, you'll learn how to perform advanced data transformations not available in the Query Editor. We will discuss how to leverage the embedded PowerBI programming language (M) to achieve this.
You need to perform data transformations in the Query Editor that cannot be done by simply using the User Interface.
To perform complex operations on data in the Power Query Editor
Explore the most powerful tool to build data models, forecast estimates, perform what-if-analysis scenario etc. If you are yet to have the Power BI license, you would still be able to create powerful & blended reports and share it internally using Power Pivot.
The easiest way to create a data model in Power BI and Power Pivot is to gather the data "as is" from a data source, define relationships, and then start designing reports. But this approach raises several issues when you have too many tables, or different levels of granularity.
Benefits of a proper data model with power pivot includes:
Extract - Transform - Load. Extract Data from multiple data sources, transform it with SSIS inbuilt transformation options or use M-Programs with SSIS and, Load it to the Reporting Database or Data Warehouse for generating dynamic BI Reports.
Businesses receive data from outside of their systems and need to perform data-quality routines to standardize and clean the data before loading it into their systems.
SSIS can handle most data situations from heterogeneous databases or flat files. This is commonly the case when different areas of the business use different standards and formats for the information. Sometimes the data formats are different because the platforms from which they originate differ from the intended destination.
In these cases, SSIS includes a rich set of data-transformation tasks to perform a wide range of data-cleaning, converting, and enriching functions. You can replace values or get descriptions from code values by using exact or fuzzy lookups within SSIS. Identifying records that may be duplicates by using SSIS grouping transformations helps to successfully remove them before loading to the destination.
Data for Power BI can come from many sources, but often the data is hosted in SQL Server. This section will teach you how to write accurate, effective, and robust T-SQL code- the right way and also understand the logic behind the same.
MS-SQL is a recommended skill while working with Power BI. You can say it is one of the basic building block if you are looking forward to work full-time with BI.
It offers you more flexibility to implement complication logic which otherwise requires multiple steps inside Power BI model. Also, if you're using direct query mode then you need to have a strong knowledge on SQL as almost all processing happens at the source systems else you would restrict yourself to only limited modeling and designing visualizations.
Important things MS-SQL can help you with
Why to have MS-SQL as Data warehouse?
While power query could do the major transformations - required for the reporting purpose, it is not advisable and recommended to access the production database for reporting requirements. ETL data from multiple data sources into your data warehouse and then load it to your BI via T-SQL is the best practice.
When company environment doesn't support Power Apps, it is tools like VBA which comes to rescue. This section will explore the power of VBA and help you automate processes or tasks which otherwise is not possible using Power BI tools.
Primary objective of learning VBA is to collect data from multiple and ad-hoc sources before uploading it to the SQL for reporting purpose.
This section will help you put together Excel, VBA, Power BI, DAX, Power Query and SQL to architect the best BI solution. You'll also learn to publish, securely share reports including row level permissions along with BI administrative tasks like setting up data gateways etc.
The whole purpose of this section is to arrive at the best possible BI reporting solution for existing business problems instead of just performing a task.
Excel is to BI what wireframing is to application development. Brush up your Excel skills with 60+ formulas, pivots, charts & dashboards to quickly build a POC with small data before investing your time in building complex BI reports with big datasets.
You need not be an expert in Excel, but it does come in handy to be proficient in Excel as it is estimated that 80% of data scientist's time is spent cleaning and preparing data - which becomes a cakewalk with Excel.
You can consider Excel more or less as the foundation to Power BI.
Getting started with Power BI is simple. Then, once you want to leverage its full potential, you need a different set of skills. Learn how to develop these skills, unlock more insights through better data analysis and visualization with this section.
Besides all technical reasons, It is everywhere - Power BI is a leader in Gartner's Magic Quadrant for Analytics and Business Intelligence Platforms.
There is a reason it's called "Power" BI - An incredibly powerful tool for both modeling and visualizing data. It has the same base as Power Query.
As an Analyst, you would find Microsoft Power BI to be a fantastic tool that can handle most of the analytics pipeline. It goes from ingesting and modeling data to presenting it as dashboards and sharing the dashboards with the people who care about them.
Add analytical power to your Power BI model that is not available in the data as-is, using DAX. The goal of this section is to teach you basic to advance features of DAX, providing the knowledge to write formulas for common and advanced business scenarios.
DAX is used in several Microsoft Products such as Microsoft Power BI, Microsoft Analysis Services and Microsoft Power Pivot for Excel. These products all share the same internal engine, called Tabular/Vertipaq (xVelocity before).
With DAX you have the ability to include business logic in calculations in order to enrich your business intelligence models.
During this section, you'll learn how to perform advanced data transformations not available in the Query Editor. We will discuss how to leverage the embedded PowerBI programming language (M) to achieve this.
You need to perform data transformations in the Query Editor that cannot be done by simply using the User Interface.
To perform complex operations on data in the Power Query Editor
Explore the most powerful tool to build data models, forecast estimates, perform what-if-analysis scenario etc. If you are yet to have the Power BI license, you would still be able to create powerful & blended reports and share it internally using Power Pivot.
The easiest way to create a data model in Power BI and Power Pivot is to gather the data "as is" from a data source, define relationships, and then start designing reports. But this approach raises several issues when you have too many tables, or different levels of granularity.
Benefits of a proper data model with power pivot includes:
Extract - Transform - Load. Extract Data from multiple data sources, transform it with SSIS inbuilt transformation options or use M-Programs with SSIS and, Load it to the Reporting Database or Data Warehouse for generating dynamic BI Reports.
Businesses receive data from outside of their systems and need to perform data-quality routines to standardize and clean the data before loading it into their systems.
SSIS can handle most data situations from heterogeneous databases or flat files. This is commonly the case when different areas of the business use different standards and formats for the information. Sometimes the data formats are different because the platforms from which they originate differ from the intended destination.
In these cases, SSIS includes a rich set of data-transformation tasks to perform a wide range of data-cleaning, converting, and enriching functions. You can replace values or get descriptions from code values by using exact or fuzzy lookups within SSIS. Identifying records that may be duplicates by using SSIS grouping transformations helps to successfully remove them before loading to the destination.
Data for Power BI can come from many sources, but often the data is hosted in SQL Server. This section will teach you how to write accurate, effective, and robust T-SQL code- the right way and also understand the logic behind the same.
MS-SQL is a recommended skill while working with Power BI. You can say it is one of the basic building block if you are looking forward to work full-time with BI.
It offers you more flexibility to implement complication logic which otherwise requires multiple steps inside Power BI model. Also, if you're using direct query mode then you need to have a strong knowledge on SQL as almost all processing happens at the source systems else you would restrict yourself to only limited modeling and designing visualizations.
Important things MS-SQL can help you with
Why to have MS-SQL as Data warehouse?
While power query could do the major transformations - required for the reporting purpose, it is not advisable and recommended to access the production database for reporting requirements. ETL data from multiple data sources into your data warehouse and then load it to your BI via T-SQL is the best practice.
When company environment doesn't support Power Apps, it is tools like VBA which comes to rescue. This section will explore the power of VBA and help you automate processes or tasks which otherwise is not possible using Power BI tools.
There are many important tasks / activities which cannot be done using Power Bi components like -
It is tool like VBA which can enhance the power of your BI and help you turn the solution to a full-fledge end to end automation.
This section will help you put together Excel, VBA, Power BI, DAX, Power Query and SQL to architect the best BI solution. You'll also learn to publish, securely share reports including row level permissions along with BI administrative tasks like setting up data gateways etc.
The whole purpose of this section is to arrive at the best possible BI reporting solution for existing business problems instead of just performing a task.
A snapshot of what will be covered in 1-year course.
Objective: To prepare a quick POC with small data and get the concurrence on the output before investing time on huge datasets.
Objective: To do faster queries, simpler DAX code and enjoy easier maintenance.
Objective: Getting started with Power BI and leverage it’s full potential to develop compelling visualizations.
Objective: To learn different methods to Transform Data before uploading it to the SQL Database.
Objective: To add analytical power to your Power BI model that is not available in the data as-is, using DAX.
Objective: To query MS-SQL Database (es) by writing accurate, effective, and robust T-SQL code - the right way.
Objective: Leverage DAX potential to perform advanced data analytics
Objective: To perform advanced and complex data transformations not available in the Query Editor
Objective: Get hands-on experience with advanced administration settings, permissions, Data refresh times etc.
Objective: To collect data from multiple ad-hoc sources and prepare it for loading it to SQL Database for BI Reporting purpose.
Objective: To collect data from multiple ad-hoc sources and prepare it for loading it to SQL Database for BI Reporting purpose.
Objective: Extract Data from multiple data sources, transform them with SSIS or M-Program transformation options and, Load it to Reporting Database / Data Warehouse
Objective: To put our entire learning to use and arrive at the best possible BI solution -using the right combination of available technologies.
One-time payment and installment - both are available.
Avail additional 10% Corporate Benefit*
on the total course fee for
5+
participants.
Get you team BI ready, today.
Online & Classroom (both are available).
Take exam and get certified for in-demand data tools.
Exam ID : EG-901
Eligibility : On clearing post-training assessment
Exam ID : EG-902
Eligibility : On clearing post-training assessment
Exam ID : EG-903
Eligibility : On clearing post-training assessment
Exam ID : EG-904
Eligibility : On implementing a Live VBA project
Exam ID : EG-905
Eligibility : On clearing post-training assessment
Exam ID : EG-906
Eligibility : On clearing post-training assessment
Exam ID : EG-907
Eligibility : On clearing post-training assessment
Exam ID : EG-908
Eligibility : On clearing post-training assessment
Exam ID : FSBI-001
Eligibility : On securing above 8-certificates

Mr. Sami
(MCT, MCP, MEE, MOS)
A snapshot of what you'll be learning in 50-weeks.
Kindly enter your Mobile Number for verification.
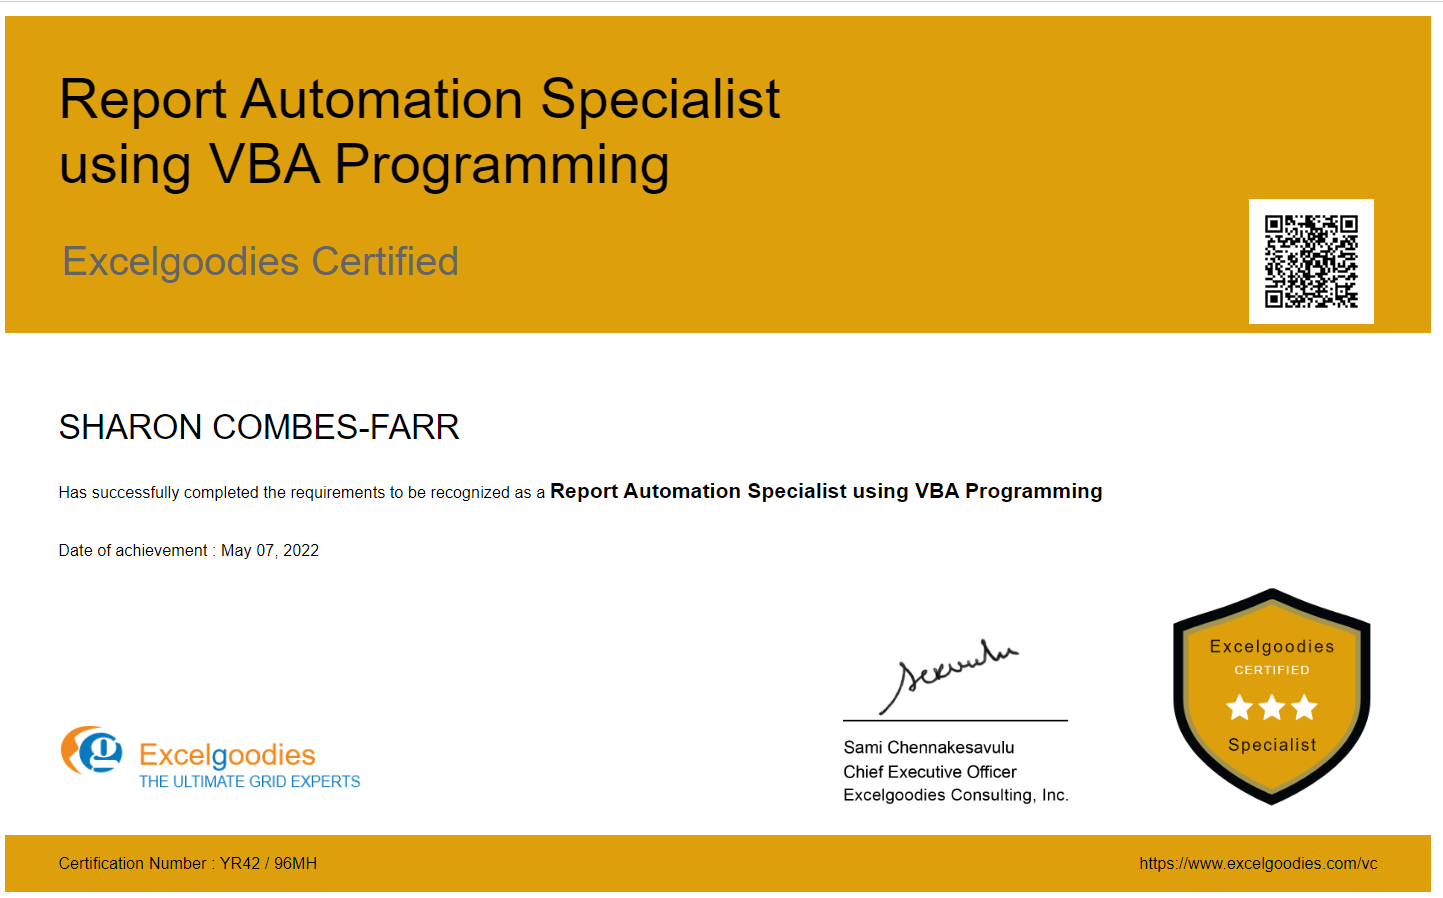
You'll honored with total of 9-certificates through-out the program.
Exam ID: EG-901
Eligibility: On clearing post-training assessment
Sample Certificate: View here
Exam ID: EG-902
Eligibility: On clearing post-training assessment
Sample Certificate: View here
Exam ID: EG-903
Eligibility: On clearing post-training assessment
Sample Certificate: View here
Exam ID: EG-904
Eligibility: On implementing a Live VBA project
Sample Certificate: View here
Exam ID: EG-905
Eligibility: On clearing post-training assessment
Sample Certificate: View here
Exam ID: EG-906
Eligibility: On clearing post-training assessment
Sample Certificate: View here
Exam ID: EG-907
Eligibility: On clearing post-training assessment
Sample Certificate: View here
Exam ID: EG-908
Eligibility: On clearing post-training assessment
Sample Certificate: View here
Exam ID: FSBI-001
Eligibility: On securing above 8-certificates
Sample Certificate: View here
Note: Above are required during the first 8 months of the training.
Excelgoodies Software Private Limited
56, 1st & 2nd Floor, North Boag Road,
T. Nagar, Chennai - 600 017
Mr.RajBusiness Associate
Tel: +91 9176633248
Email: support@excelgoodies.com
Connect us on
Mr. Sami, Microsoft Certified Trainer, with his qualifications in Finance, HR & Information Technology brings in 14 years of Industry experience. He has successfully trained 9500+ professionals by now, and the counting is still on.
He has undertaken assignments with the renowned IRS, The World Bank, Tata Chemicals, Buckman Laboratories, Standard Chartered, ING Barings and much more. His nature of going that Extra Mile has got him the startling popularity amongst the Excelgoodies prominent clients.
Systematic + Continuing Education: Our unique learning model is the first of its kind in India.
Learn a new reporting tool every month during the next 12 months.

Every analyst and the business user thinks about which tool to learn next - which can improve his CV. This full-stack course is designed to cover all BI reporting tools in a phased approach (what tool to learn first and next) - which will help you to retain information and perform much better. This, in turn, will help you add lines to your resumé and get a portfolio of projects.
Master every tool that you've learnt with our continuing education.

Although our training will help you learn a new tool every month, it is our continuing education curriculum that will give you the exposure you need to master a tool. This includes real-time Assignments, Case Studies & Projects.
The idea here is to introduce a new tool, immediately revisit it through multiple assignments - across the year and actively use the tool back at work to deepen understanding and move it to long-term memory.
Take a baby step approach and become a 360-degree BI Reporting expert.

Small, attainable goals and mini-victories work wonders to propel us towards a bigger goal. Take a few baby steps at a time and you're set. Therefore, our teaching methodology uses a series of short and intensive sessions combined with activities. And after every milestone, you will honored with a specialist certificate.
This is the simplest, yet the most effective learning strategy to master any subject and make a career advancement.
No more "What if I forget these topics, later?"
No more "Will I be able to implement all this at work?"

Our entire continuing education program is designed with the belief that the more you revisit the topic you are trying to learn, the more you reinforce the idea in your long-term memory.
This means you will be working on numerous case studies and tasks throughout the year to help you remember the topics you learned from the very first day.
By the end of 12 months, work as a tech-savvy functional professional in your own domain. Begin your career transformation journey into core technology or Data science with the techno-functional expertise earned.
Watching the new-tech unfold in BI Industry? Time to be part of it.
Discuss your career transformation with a Data Professional.
Systematic + Continuing Education: Our unique learning model is the first of its kind in India.
Learn a new reporting tool every month during the next 12 months.
Every analyst and the business user thinks about which tool to learn next - which can improve his CV. This full-stack course is designed to cover all BI reporting tools in a phased approach (what tool to learn first and next) - which will help you to retain information and perform much better. This, in turn, will help you add lines to your resumé and get a portfolio of projects.
Master every tool that you've learnt with our continuing education.
Although our training will help you learn a new tool every month, it is our continuing education curriculum that will give you the exposure you need to master a tool. This includes real-time Assignments, Case Studies & Projects.
The idea here is to introduce a new tool, immediately revisit it through multiple assignments - across the year and actively use the tool back at work to deepen understanding and move it to long-term memory.
Take a baby step approach and become a 360-degree BI Reporting expert.
Small, attainable goals and mini-victories work wonders to propel us towards a bigger goal. Take a few baby steps at a time and you're set. Therefore, our teaching methodology uses a series of short and intensive sessions combined with activities. And after every milestone, you will honored with a specialist certificate.
This is the simplest, yet the most effective learning strategy to master any subject and make a career advancement.
No more "What if I forget these topics, later?"
No more "Will I be able to implement all this at work?"
Our entire continuing education program is designed with the belief that the more you revisit the topic you are trying to learn, the more you reinforce the idea in your long-term memory.
This means you will be working on numerous case studies and tasks throughout the year to help you remember the topics you learned from the very first day.


Get the 10x advantage in your transformation journey to data professional.
A snapshot of what you'll be learning in 50-weeks.
Kindly enter your Mobile Number for verification.
You'll honored with total of 9-certificates through-out the program.
Exam ID: EG-901
Eligibility: On clearing post-training assessment
Sample Certificate: View here
Exam ID: EG-902
Eligibility: On clearing post-training assessment
Sample Certificate: View here
Exam ID: EG-903
Eligibility: On clearing post-training assessment
Sample Certificate: View here
Exam ID: EG-904
Eligibility: On implementing a Live VBA project
Sample Certificate: View here
Exam ID: EG-905
Eligibility: On clearing post-training assessment
Sample Certificate: View here
Exam ID: EG-906
Eligibility: On clearing post-training assessment
Sample Certificate: View here
Exam ID: EG-907
Eligibility: On clearing post-training assessment
Sample Certificate: View here
Exam ID: EG-908
Eligibility: On clearing post-training assessment
Sample Certificate: View here
Exam ID: FSBI-001
Eligibility: On securing above 8-certificates
Sample Certificate: View here
Note: Above are required during the first 8 months of the training.
Excelgoodies Software Private Limited
56, 1st & 2nd Floor, North Boag Road,
T. Nagar, Chennai - 600 017
Mr.RajBusiness Associate
Tel: +91 9176633248
Email: support@excelgoodies.com
Connect us on
Mr. Sami, Microsoft Certified Trainer, with his qualifications in Finance, HR & Information Technology brings in 14 years of Industry experience. He has successfully trained 9500+ professionals by now, and the counting is still on.
He has undertaken assignments with the renowned IRS, The World Bank, Tata Chemicals, Buckman Laboratories, Standard Chartered, ING Barings and much more. His nature of going that Extra Mile has got him the startling popularity amongst the Excelgoodies prominent clients.


One of the best training classes attended so far. A very professional approach, well designed way of teaching. The trainer made sure that even the most slowest learner understands the concepts well. Their true intentions to make sure that everybody who attends should not complete just for the sake of completion but should understand all the concepts was very evident.
They were encouraging us to attend reclasses we dint understand any topic or wanted to learn one more time. Worthyful of the money and time spent. My special thanks and appreciations to sami sir and sai sir for their incredible teaching. Definitely would happy to recommend to others.
I am impressed with the methodology with excel goodies. It was a great learning experience for me at Excel goodies. A professional training institutions and clear road map given to students to achieve their goals.
Top class training program with step by step guidance. Had gained much knowledge in Excel VBA.! Especially Mr.Sami guided us a lot in best way. It was an very good experience with Sami and Sai. Thanks a lot to both of them. :)
I went through the VBA training here at Excelgoodies. The tutors are extremely knowledgeable and helpful. The training programme flow is well planned and helps us to scale up to doing automation in our work place. I found it very useful and it definitely helps anyone doing Excel consolidation and routine reports.
The tutors give individual focus and ensure that all students in the group have properly understood each topic. They even take the same topic again in case we do not understand. I strongly feel there is value for money for the coaching they give. At the end of the course, I could do live projects in my organisation !! Thanks to Excelgoodies :)
My overall experience at Excel Goodies was very very good - All along I used to browse the web to get a VBA Code for my requirement now and then, but the training / guidance offered at Excel Goodies by Mr.Sami and Mr.Sai has really put me in a position whereby, I can really read through the codes and understand how it works and start constructing my own.
Infact I have been looking for a Guru to teach me the fundamentals on VBA Automation for quite a long period, in order to implement my thought process on automating many of the day to day activities that are carried out at my work place and by my clients. When I was casually discussing my passion with my relative, he immediately recommended Excel Goodies to me for doing this course.
Now I am really thankful to him. I strongly recommend Excel Goodies to those who have a passion to master their Excel skills and to venture into VBA Automation, and I am planning to put my son who is a budding CMA Professional into this course. All the very best to all prospective students and Thanks to Mr.Sami & Mr.Sairam and Excel Goodies for giving me a nice learning experience.
Excelgoodies surprises me on how well they cater their programs so perfectly structured and carried out. Cannot ask for better. The programs very well co-ordinated and tailor-tweaked along the course to ensure the best is delivered. Strongly recommend excelgoodies!
Awesome and Structured well professionalled Centre I have seen so far.. the way they organized each sessions was fantastic. I'm very impressed with the vision you guys having against the training program..
Mr.Sami and Mr.Sai thank you so much for your time and patience with us..I'm lucky that I had completed my course in 2019 and starting 2020 with the pride of learning from Excelgoodies.. Rock On - All the best to the team.
I have taken up the VB course during Jan 2019 in ExcelGoodies(EG) - I will strongly recommend Working Professional/Finance Students to take it up the course here in ExcelGoodies. EG is highly professional in terms of conducting trainings, coaching and guiding people in right direction.
My Special kudos to Sami/Sai sir for the wonderful coaching style/techniques followed throughout the 3 months course. Until i joined the course i felt like VB is coding language which Non-Engineering students cannot understand but Sami sir break the assumption and made it clear that anyone can learn VB if they really aspire to learn it.
Thanks once again !!!! Looking forward to opt many course in future in EG (Ex: Power BI, Advance Excel Techniques etc).
My training experience was good... Both the trainers are very knowledgeable as well as very kind... I am a commerce graduate but they have trained me very well with my small amount of excel knowledge.... Whenever I asked coding related clarifications, they helped me immediately... Thanks to Sai and Sami sir..
Mr. Sami/Sai I believe that you have great mastery and expertise in Excel and VBA automation. You have an art in breaking up complex principles into simple and understandable teaching methods.
Excelgoodies has enhanced my skills and taken me to a all new level. I trust you will support me in completing my project. I would surely refer this institute to my colleagues.
Average annual salary of a Data-Professional in India is INR 10L - 15L (Source: Ziprecruiter & Gartner)
Average annual salary of a Data-Professional in India is INR 10L - 15L (Source: Ziprecruiter & Gartner)
You are required to use your analytical and
techinical capabilities to extract
meaningful insights from data.
They ensure uninterrupted flow of data between servers and applications and are also reponsible for data architecture
Average Salary: INR 8L - 9L PAThey build the designs created by solution architects. They develop, maintain, test and evaluate big data solutions with organization.
Average Salary: INR 10L - 12L PAThey assists in testing activities and in the development of test scripts, performing research to understand business issues, and developing cost-effective solutions.
Average Salary: INR 15L - 18L PAThey conceptualize, design, develop and provide production support of interactive data visulizations used across the enterprise. They possess an artistic mind.
Average Salary: INR 7L - 9L PAThey have data analytics expertise and the experience of setting up reporting tools, querying and maintaining data warehouses. They are hands-on wiith big data and take a data-driven approach to solving problems.
Average Salary: INR 17L - 23L PAThey come up with solutions quickly to help businesses in making time sensitive decisions, have strong communication & analytical skills, passion for data visualization, and a drive for excellence.
Average Salary: INR 14L - 40L PAThey are responsible for supporting an enterprise wide BI framework. This position requires crictical thinking, attention to detail, and effective communication skills.
Average Salary: INR 10L - 12L PAThey are responsible for configuration, design, implementation, and support of data analysis solution or BI tool. They are required to analyze huge data gathered from transactional activity.
Average Salary: INR 20L- 23L PASources: Glassdoor, Ambitionbox, Gartner
An analytics insight survey from 2021 had estimated a total of 3,03,809 new openings (India) in the field of data science for the year and this trend has been on the rise over the past 5 years.
But the challenge is that over 60% of the companies believe that it is not easy to fill data science roles because of severe talent shortages i.e. finding the right skill sets & real-world project experience. For candidates, the problems are very similar, the lack of practical exposure & the ability to showcase their analytical ability at work.
What makes this program unique?

A comprehensive program that starts with the
fundamentals of the logic building (Excel) to
advanced topics like connecting front-end
visualization to back-end data warehouse and
architecting the best possible BI Solution.

Course works cover essential elements of data
science and analytics, including Data cleaning,
Data Querying, Analytics, Data Visualization,
and much more.

Get practical exposure to tools like Power BI,
Python, MSSQL, etc. by completing 30+
comprehensive projects.

Practical exposure to most in-demand concept
ETL with SSIS to architect a BI solution.

Latest curriculum designed for the industry
with excellent technical support by trainers.
What makes this program unique?
A comprehensive program that starts with the
fundamentals of the logic building (Excel) to
advanced topics like connecting front-end
visualization to back-end data warehouse and
architecting the best possible BI Solution.
Course works cover essential elements of data
science and analytics, including Data cleaning,
Data Querying, Analytics, Data Visualization,
and much more.
Get practical exposure to tools like Power BI,
Python, MSSQL, etc. by completing 30+
comprehensive projects.
Practical exposure to most in-demand concept
ETL with SSIS to architect a BI solution.
Latest curriculum designed for the industry
with excellent technical support by trainers.


.jpg "Velammal-Chennai")


Registration Closes on
Wednesday, 01 May.
Excelgoodies Software Private Limited
No.56, 1 & 2 Floor, North Boag Road,
T-Nagar, Chennai - 17
Mr.Raj
Business Associate
INDIA