Fill-in the details.

Power BI | MS-SQL | ETL with SSIS | VBA | Python
Advanced Excel | MIS Reporting | Power Query
VB Programming | VBA | MS-Office Automation
Power BI | Power Pivot | Power Query | Basic DAX
Advanced Excel | MIS Reporting | Model Building
Course on Management Reporting & Business Modeling using MS-Excel.
25-hrs Course | 60+ Advanced Formulas | 7 Reporting Projects | View Schedule
25-hrs Course | 60+ Advanced Formulas | 7 Reporting Projects View Schedule
This is a 25-hour, activity-based program, designed to give you extensive exposure on mining, structuring and, modeling varied data to come up with the required analysis and MIS Reports using Microsoft Excel.
Master the Excel essentials of the real world and accelerate your career.
This section aims to bring all the candidates to the same level before moving to the most intensive, advanced and complex topics. It aims to equip you with a strong foundational knowledge of Excel to organize, analyze and work with data.
All the participants come from different domain with different levels of Excel expertise. Brush-up will help you to fill up the gaps and get everyone at the same level to proceed with intense sessions. This will also ensure a structured learning.
This section will cover 60+ essential, productive time-saving functions and formula-building techniques through suitable examples, required to solve a variety of data analysis problems. You'll also learn how to debug a formula, audit them, and simplify the complex functions.
1. Sum
2. Sumif
3. Sumifs
4. Average
5. Averageif
6. Averageifs
7. Max
8. Min
9. Sumproduct
10. Count
11. CountA
12. Countblank
13. Subtotal
1. Vlookup
2. Dynamic Vlookup
3. Hlookup
4. Dynamic Hlookups
5. Match
6. Index
7. Indirect
8. Offset
1. Istext
2. Code
3. Char
4. Exact
5. Len
6. Trim
7. Upper
8. Lower
9. Proper
10. Left
11. Right
12. Mid
13. Substitue
14. Replace
15. Find
16. Search
1. Date
2. Datevalue
3. Day
4. Days360
5. EDate
6. Emonth
7. Month
8. Today
9. Weekday
10. Year
11. Now
12. Hour
13. Minute
14. Second
15. Time
16. Timevalue
1. Ceiling
2. Even
3. Floor
4. INT
5. Mround
6. Odd
7. Round
8. Roundup
9. Rounddown
10. Trunc
1. Isna
2. Iserr
3. Iserror
This section is designed for Excel users to crunch numbers substantially, create reports dynamically using PivotTable, and, present professional information through Dashboards in Microsoft Excel that are beautiful, precise, and clear.
This section will help you plug in all the Advanced Excel concepts learned in previous sections to work on various MIS reports such as summary reports, trend reports, exception reports, financial reports, inventory reports, sales reports, budget reports, etc.
Different types of MIS reports aggregate different data points and present them in a format that provides clear insights and conclusions. The various departments in an organization present MIS report which outline their department’s specific functions. There can be different types of MIS reports based on which data is being analyzed and what it is being used for. We’ve tried to summarize the most 15 common types of MIS reports which you will find in an organization.
This is the most important step for all the reporting requirements. You'll learn to prepare raw data for analysis by removing bad data, organizing the raw data, and filling in the null values. Data cleaning in data mining has utmost value when working with big data.
Data cleansing, also referred to as data cleaning or data scrubbing, is the process of fixing incorrect, incomplete, duplicate or otherwise erroneous data in a data set. It involves identifying data errors and then changing, updating or removing data to correct them.
Data cleansing is a key part of the overall data management process and one of the core components of data preparation work that readies data sets for use in business intelligence (BI) and data science applications.
It's typically done by data quality analysts and engineers or other data management professionals. But data scientists, BI analysts and business users may also clean data or take part in the data cleansing process for their own applications.
Common data errorsBudgeting and financial forecasting are tools that companies use to establish a plan for where management wants to take the business budgeting and whether it is heading in the right direction—financial forecasting. This section will guide you to build such models.
A budget model is a framework for how you create and manage your budget.
Most people are familiar with the different approaches to budgeting for personal finances like the envelope method or 50/30/20.
Similarly, there are multiple approaches to creating a budget for your business.
5 most common types of budget models used
There are three basic types—qualitative techniques, time series analysis and projection, and causal models. The first uses qualitative data (expert opinion, for example) and information about special events of the kind already mentioned and may or may not take the past into consideration.
The second, on the other hand, focuses entirely on patterns and pattern changes, and thus relies entirely on historical data.
The third uses highly refined and specific information about relationships between system elements and is powerful enough to take special events formally into account. As with time series analysis and projection techniques, the past is important to causal models.
| * |
The topics marked in red are advanced training modules - available at an additional cost.
|
This section aims to bring all the candidates to the same level before moving to the most intensive, advanced and complex topics. It aims to equip you with a strong foundational knowledge of Excel to organize, analyze and work with data.
All the participants come from different domain with different levels of Excel expertise. Brush-up will help you to fill up the gaps and get everyone at the same level to proceed with intense sessions. This will also ensure a structured learning.
This section will cover 60+ essential, productive time-saving functions and formula-building techniques through suitable examples, required to solve a variety of data analysis problems. You'll also learn how to debug a formula, audit them, and simplify the complex functions.
1. Sum
2. Sumif
3. Sumifs
4. Average
5. Averageif
6. Averageifs
7. Max
8. Min
9. Sumproduct
10. Count
11. CountA
12. Countblank
13. Subtotal
1. Vlookup
2. Dynamic Vlookup
3. Hlookup
4. Dynamic Hlookups
5. Match
6. Index
7. Indirect
8. Offset
1. Istext
2. Code
3. Char
4. Exact
5. Len
6. Trim
7. Upper
8. Lower
9. Proper
10. Left
11. Right
12. Mid
13. Substitue
14. Replace
15. Find
16. Search
1. Date
2. Datevalue
3. Day
4. Days360
5. EDate
6. Emonth
7. Month
8. Today
9. Weekday
10. Year
11. Now
12. Hour
13. Minute
14. Second
15. Time
16. Timevalue
1. Ceiling
2. Even
3. Floor
4. INT
5. Mround
6. Odd
7. Round
8. Roundup
9. Rounddown
10. Trunc
1. Isna
2. Iserr
3. Iserror
This section is designed for Excel users to crunch numbers substantially, create reports dynamically using PivotTable, and, present professional information through Dashboards in Microsoft Excel that are beautiful, precise, and clear.
Getting started with Power BI is simple. Then, once you want to leverage its full potential, you need a different set of skills. Learn how to develop these skills, unlock more insights through better data analysis and visualization with this section.
Different types of MIS reports aggregate different data points and present them in a format that provides clear insights and conclusions. The various departments in an organization present MIS report which outline their department’s specific functions. There can be different types of MIS reports based on which data is being analyzed and what it is being used for. We’ve tried to summarize the most 15 common types of MIS reports which you will find in an organization.
This is the most important step for all the reporting requirements. You'll learn to prepare raw data for analysis by removing bad data, organizing the raw data, and filling in the null values. Data cleaning in data mining has utmost value when working with big data.
Data cleansing, also referred to as data cleaning or data scrubbing, is the process of fixing incorrect, incomplete, duplicate or otherwise erroneous data in a data set. It involves identifying data errors and then changing, updating or removing data to correct them.
Data cleansing is a key part of the overall data management process and one of the core components of data preparation work that readies data sets for use in business intelligence (BI) and data science applications.
It's typically done by data quality analysts and engineers or other data management professionals. But data scientists, BI analysts and business users may also clean data or take part in the data cleansing process for their own applications.
Common data errorsBudgeting and financial forecasting are tools that companies use to establish a plan for where management wants to take the business budgeting and whether it is heading in the right direction—financial forecasting. This section will guide you to build such models.
A budget model is a framework for how you create and manage your budget.
Most people are familiar with the different approaches to budgeting for personal finances like the envelope method or 50/30/20.
Similarly, there are multiple approaches to creating a budget for your business.
5 most common types of budget models used
There are three basic types—qualitative techniques, time series analysis and projection, and causal models. The first uses qualitative data (expert opinion, for example) and information about special events of the kind already mentioned and may or may not take the past into consideration.
The second, on the other hand, focuses entirely on patterns and pattern changes, and thus relies entirely on historical data.
The third uses highly refined and specific information about relationships between system elements and is powerful enough to take special events formally into account. As with time series analysis and projection techniques, the past is important to causal models.
| * |
The topics marked in red are advanced training modules - available at an additional cost.
|
Excel Learning Redefined.

LEARN from Microsoft Certified Trainers

PRACTICE with 150+ Assignments

REVISE with 10+ Case Studies

SPEED-UP with our Excel Shortcut Tool

ON-JOB Support to implement learnings
A snapshot of what you'll be learning in 8-Weekends.
Objective: The term "basic" is subjective based on levels of knowledge, experience, exposure, etc. Basic for one individual doesn't have to be basic for another. Nearly all participants in this training are self-taught and have some Excel skills as well as some gaps.
The objective of this module is to fill gaps, bring everyone to the same level and empower them with comfort and confidence to learn Excel as a reporting solution and not as a computer tool.
Duration – 2.5 Hours (Rapid Session)
Objective: Master 60+ MS Excel formulas to dramatically simplify the work you do in Excel. By the end of the section, you'll be writing robust, elegant formulas from scratch.
Duration – 5 Hours
Objective: This module will help you set up a professional dashbaord - learn how to visualize data through graphs and charts, create data models, and add interactivity.
Duration – 2.5 Hours
Objective: This section is all about working with data - and making it easy to work with. It will walk you through the different features of Excel to get your data prepared for analysis.
Duration – 2.5 Hours
Objective: It is an activity-based section with the goal of collaborating on all the topics you have learned so far to build dynamic MIS Reports. You'll learn to model different scenarios based on input, and assumptions.
Duration – 7.5 Hours
Course Fee
INR 7500Note: INR 500 will get adjusted towards the Total Course Fee.
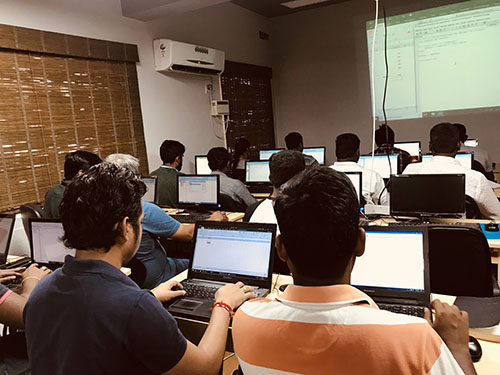
25 hours of Instructor-led training.
150+ Assignments (available only at EG Premises)
7 Reporting Projects
Excel Shortcut Tool (Lifetime access)
30-Days post-training support (via Email)
MIS Reporting Specialist Certificate
View Certificate| Session | Date | Time |
|---|---|---|
| Session 1 | Sat, 04 May | 5:30 PM - 8:00 PM |
| Session 2 | Sat, 11 May | 5:30 PM - 8:00 PM |
| Session 3 | Sat, 18 May | 5:30 PM - 8:00 PM |
| Session 4 | Sat, 25 May | 5:30 PM - 8:00 PM |
| Session 5 | Sun, 02 June | 4:00 PM - 6:00 PM |
| Session 6 | Sun, 09 June | 4:00 PM - 6:00 PM |
| Session 7 | Sun, 16 June | 4:00 PM - 6:00 PM |
| Session 8 | Sun, 23 June | 4:00 PM - 6:00 PM |
ExcelGoodies Software Private Limited.
56, 1st Floor, North Boag Road,
T. Nagar, Chennai - 600 017
Mr. RajBusiness Associate
Tel: 9176633248
Connect us on |
Advanced Excel & MIS Reporting Specialist Eligibility: On clearing post-training assessment. View Sample Certificate |
|
Microsoft Office Specialist (MOS) by Microsoft
To be availed at an additional cost. View Sample Certificate |

Mr. Sami, Microsoft Certified Trainer, with his qualifications in Finance, HR & Information Technology brings in 14 years of Industry experience. He has successfully trained 9500+ professionals by now, and the counting is still on.
He has undertaken assignments with the renowned IRS, The World Bank, Tata Chemicals, Buckman Laboratories, Standard Chartered, ING Barings and much more. His nature of going that Extra Mile has got him the startling popularity amongst the Excelgoodies prominent clients.
Objective: The term "basic" is subjective based on levels of knowledge, experience, exposure, etc. Basic for one individual doesn't have to be basic for another. Nearly all participants in this training are self-taught and have some Excel skills as well as some gaps.
The objective of this module is to fill gaps, bring everyone to the same level and empower them with comfort and confidence to learn Excel as a reporting solution and not as a computer tool.
Duration – 2.5 Hours (Rapid Session)
Objective: Master 60+ MS Excel formulas to dramatically simplify the work you do in Excel. By the end of the section, you'll be writing robust, elegant formulas from scratch.
Duration – 5 Hours
Objective: This module will help you set up a professional dashbaord - learn how to visualize data through graphs and charts, create data models, and add interactivity.
Duration – 2.5 Hours
Objective: This section is all about working with data - and making it easy to work with. It will walk you through the different features of Excel to get your data prepared for analysis.
Duration – 2.5 Hours
Objective: It is an activity-based section with the goal of collaborating on all the topics you have learned so far to build dynamic MIS Reports. You'll learn to model different scenarios based on input, and assumptions.
Duration – 7.5 Hours
Training Schedule
| Session | Date | Time |
|---|---|---|
| Session 1 | Sat, 04 May | 5:30 PM - 8:00 PM |
| Session 2 | Sat, 11 May | 5:30 PM - 8:00 PM |
| Session 3 | Sat, 18 May | 5:30 PM - 8:00 PM |
| Session 4 | Sat, 25 May | 5:30 PM - 8:00 PM |
| Session 5 | Sun, 02 June | 4:00 PM - 6:00 PM |
| Session 6 | Sun, 09 June | 4:00 PM - 6:00 PM |
| Session 7 | Sun, 16 June | 4:00 PM - 6:00 PM |
| Session 8 | Sun, 23 June | 4:00 PM - 6:00 PM |
Avail additional 10% Corporate Benefit*
on the total course fee for
5+
participants.
Get you team BI ready, today.
25 hours of Instructor-led training.
150+ Assignments (available only at EG Premises)
7 Reporting Projects
Excel Shortcut Tool (Lifetime access)
30-Days post-training support (via Email)
MIS Reporting Specialist Certificate
Mr. Sami, Microsoft Certified Trainer, with his qualifications in Finance, HR & Information Technology brings in 14 years of Industry experience. He has successfully trained 9500+ professionals by now, and the counting is still on.
He has undertaken assignments with the renowned IRS, The World Bank, Tata Chemicals, Buckman Laboratories, Standard Chartered, ING Barings and much more. His nature of going that Extra Mile has got him the startling popularity amongst the Excelgoodies prominent clients.


One of the best training classes attended so far. A very professional approach, well designed way of teaching. The trainer made sure that even the most slowest learner understands the concepts well. Their true intentions to make sure that everybody who attends should not complete just for the sake of completion but should understand all the concepts was very evident.
They were encouraging us to attend reclasses we dint understand any topic or wanted to learn one more time. Worthyful of the money and time spent. My special thanks and appreciations to sami sir and sai sir for their incredible teaching. Definitely would happy to recommend to others.
I am impressed with the methodology with excel goodies. It was a great learning experience for me at Excel goodies. A professional training institutions and clear road map given to students to achieve their goals.
Top class training program with step by step guidance. Had gained much knowledge in Excel VBA.! Especially Mr.Sami guided us a lot in best way. It was an very good experience with Sami and Sai. Thanks a lot to both of them. :)
I went through the VBA training here at Excelgoodies. The tutors are extremely knowledgeable and helpful. The training programme flow is well planned and helps us to scale up to doing automation in our work place. I found it very useful and it definitely helps anyone doing Excel consolidation and routine reports.
The tutors give individual focus and ensure that all students in the group have properly understood each topic. They even take the same topic again in case we do not understand. I strongly feel there is value for money for the coaching they give. At the end of the course, I could do live projects in my organisation !! Thanks to Excelgoodies :)
My overall experience at Excel Goodies was very very good - All along I used to browse the web to get a VBA Code for my requirement now and then, but the training / guidance offered at Excel Goodies by Mr.Sami and Mr.Sai has really put me in a position whereby, I can really read through the codes and understand how it works and start constructing my own.
Infact I have been looking for a Guru to teach me the fundamentals on VBA Automation for quite a long period, in order to implement my thought process on automating many of the day to day activities that are carried out at my work place and by my clients. When I was casually discussing my passion with my relative, he immediately recommended Excel Goodies to me for doing this course.
Now I am really thankful to him. I strongly recommend Excel Goodies to those who have a passion to master their Excel skills and to venture into VBA Automation, and I am planning to put my son who is a budding CMA Professional into this course. All the very best to all prospective students and Thanks to Mr.Sami & Mr.Sairam and Excel Goodies for giving me a nice learning experience.
Excelgoodies surprises me on how well they cater their programs so perfectly structured and carried out. Cannot ask for better. The programs very well co-ordinated and tailor-tweaked along the course to ensure the best is delivered. Strongly recommend excelgoodies!
Awesome and Structured well professionalled Centre I have seen so far.. the way they organized each sessions was fantastic. I'm very impressed with the vision you guys having against the training program..
Mr.Sami and Mr.Sai thank you so much for your time and patience with us..I'm lucky that I had completed my course in 2019 and starting 2020 with the pride of learning from Excelgoodies.. Rock On - All the best to the team.
I have taken up the VB course during Jan 2019 in ExcelGoodies(EG) - I will strongly recommend Working Professional/Finance Students to take it up the course here in ExcelGoodies. EG is highly professional in terms of conducting trainings, coaching and guiding people in right direction.
My Special kudos to Sami/Sai sir for the wonderful coaching style/techniques followed throughout the 3 months course. Until i joined the course i felt like VB is coding language which Non-Engineering students cannot understand but Sami sir break the assumption and made it clear that anyone can learn VB if they really aspire to learn it.
Thanks once again !!!! Looking forward to opt many course in future in EG (Ex: Power BI, Advance Excel Techniques etc).
My training experience was good... Both the trainers are very knowledgeable as well as very kind... I am a commerce graduate but they have trained me very well with my small amount of excel knowledge.... Whenever I asked coding related clarifications, they helped me immediately... Thanks to Sai and Sami sir..
Mr. Sami/Sai I believe that you have great mastery and expertise in Excel and VBA automation. You have an art in breaking up complex principles into simple and understandable teaching methods.
Excelgoodies has enhanced my skills and taken me to a all new level. I trust you will support me in completing my project. I would surely refer this institute to my colleagues.
Contact Us
Excelgoodies Software Private Limited
No.56, 1 & 2 Floor, North Boag Road,
T-Nagar, Chennai - 17
Tel: +91 9176633248
You will learn to use the right and hybrid technology for end-to-end advanced power reporting.
Tools: Power BI, Power Pivot, VBA, Excel,
M-Programming, MS-SQL, SSIS, and many more.

Power BI

Micorsoft T-SQL
MS-SQL Integrated Services

Python

Microsoft Excel VBA

MS-Excel

Power Query


