Fill-in the details.

Power BI | MS-SQL | ETL with SSIS | VBA | Python
Advanced Excel | MIS Reporting | Power Query
VB Programming | VBA | MS-Office Automation
Power BI | Power Pivot | Power Query | Basic DAX
Advanced Excel | MIS Reporting | Model Building
Data analytics is one of the hottest IT skills and Power BI is an extremely
demanded analytics
service. This engaging, practical, and hands-on course
begins with a quick data
visualization of a
dataset; you will use this example to get hands-on and
master data storytelling.


Learn how to build and use Power BI business intelligence reports.
Getting started with Power BI is simple. Then, once you want to leverage its full potential, you need a different set of skills. Learn how to develop these skills, unlock more insights through better data analysis and visualization with this section.
Why should I learn Power BI
Add analytical power to your Power BI model that is not available in the data as-is, using DAX. The goal of this section is to teach you basic to advance features of DAX, providing the knowledge to write formulas for common and advanced business scenarios.
Why should I learn DAX
Whether you're consolidating multiple data sources, handling diverse data formats, or crafting dynamic queries, this versatile tool ensures efficiency and precision in your data preparation, spanning from data cleansing to advanced transformations.
Why should I learn Power BI
Explore the most powerful tool to build data models, forecast estimates, perform what-if-analysis scenario etc. If you are yet to have the Power BI license, you would still be able to create powerful & blended reports and share it internally using Power Pivot.
Why should I Power Pivot?
M-Programming with Power Query
*During this section, you'll learn how to perform advanced data transformations not available in the Query Editor. We will discuss how to leverage the embedded PowerBI programming language (M) to achieve this.
Why should I learn M-Programming?
Data warehousing using MS-SQL
*Data for Power BI can come from many sources, but often the data is hosted in SQL Server. This section will teach you how to write accurate, effective, and robust T-SQL code- the right way and also understand the logic behind the same.
Why should I learn MS-SQL?
Architect Power BI Solution
*This section will help you put together Excel, VBA, Power BI, DAX, Power Query and SQL to architect the best BI solution. You'll also learn to publish, securely share reports including row level premissions along with BI administrative tasks like setting up data gateways etc.
Why should I learn to Architect a Solution?
Please note that topics marked with an asterisk are advanced concepts beyond the regular Power BI program and require an additional cost. Alternatively, Our comprehensive Full Stack BI Reporting Course covers all these exciting topics.
Course Content Overview
Objective: Getting started with Power BI and leverage it’s full potential to develop compelling visualizations.
Objective: To add analytical power to your Power BI model that is not available in the data as-is, using DAX.
Objective: To learn different methods to Transform Data before uploading it to the SQL Database.
Objective: Power Query and Power Pivot complement each other. Power Query is the recommended experience for discovering, connecting to, and importing data. Power Pivot is great for modeling the data you’ve imported.
Objective: To perform advanced and complex data transformations not available in the Query Editor
Objective: Get hands-on experience with advanced administration settings, permissions, Data refresh times etc.
Objective: It complements Power Pivots and Power BI better than any other DB.
Objective: To put our entire learning to use and arrive at the best possible BI solution -using the right combination of available technologies.
Training Schedule
| Session | Date | Time |
|---|---|---|
| Session 1 | Sat, 04 May | 05:30 PM - 08:00 PM |
| Session 2 | Sat, 11 May | 05:30 PM - 08:00 PM |
| Session 3 | Sat, 18 May | 05:30 PM - 08:00 PM |
| Session 4 | Sat, 25 May | 05:30 PM - 08:00 PM |
| Session 5 | Sun, 05 May | 01:30 PM - 04:00 PM |
| Session 6 | Sun, 12 May | 01:30 PM - 04:00 PM |
| Session 7 | Sun, 19 May | 01:30 PM - 04:00 PM |
| Session 8 | Sun, 26 May | 01:30 PM - 04:00 PM |
| Session 9 | Sun, 02 Jun | 01:30 PM - 04:00 PM |
| Session 10 | Sun, 09 Jun | 01:30 PM - 04:00 PM |
| Session 11 | Sun, 16 Jun | 01:30 PM - 04:00 PM |
| Session 12 | Sun, 23 Jun | 01:30 PM - 04:00 PM |
| Session 13 | Sun, 30 Jun | 01:30 PM - 04:00 PM |
| Session 14 | Sun, 07 Jul | 01:30 PM - 04:00 PM |
| Session 15 | Sun, 14 Jul | 01:30 PM - 04:00 PM |
| Session 16 | Sun, 21 Jul | 01:30 PM - 04:00 PM |
Avail additional 10% Corporate Benefit*
on the total course fee for
5+
participants.
Get you team BI ready, today.

Mr. Sami, Microsoft Certified Trainer, with his qualifications in Finance, HR & Information Technology brings in 14 years of Industry experience. He has successfully trained 9500+ professionals by now, and the counting is still on.
He has undertaken assignments with the renowned IRS, The World Bank, Tata Chemicals, Buckman Laboratories, Standard Chartered, ING Barings and much more. His nature of going that Extra Mile has got him the startling popularity amongst the Excelgoodies prominent clients.
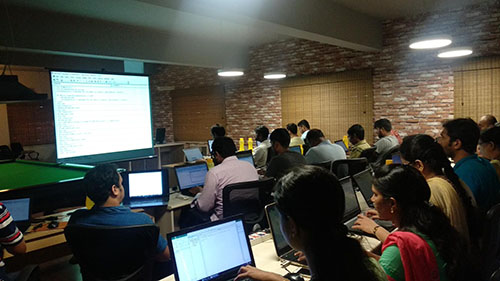
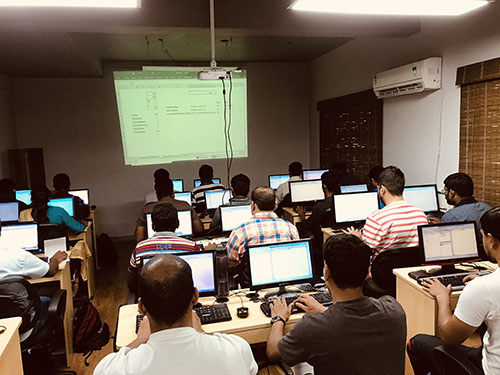
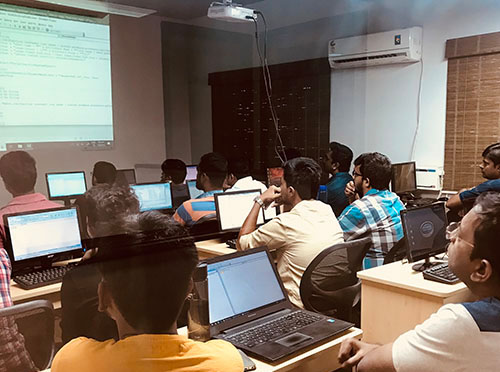
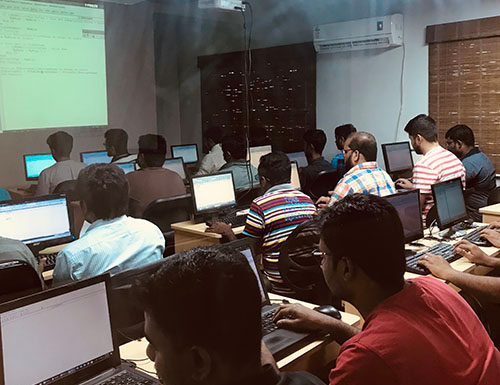
A snapshot of what you'll be learning in 12-weekends
Please note that topics marked with an asterisk are advanced concepts beyond the regular Power BI program and require an additional cost. Alternatively, our comprehensive Full Stack BI Reporting Course covers all these exciting topics.
Objective: Getting started with Power BI and leverage it’s full potential to develop compelling visualizations.
Objective: To add analytical power to your Power BI model that is not available in the data as-is, using DAX.
Objective: To learn different methods to Transform Data before uploading it to the SQL Database.
Objective: Power Query and Power Pivot complement each other. Power Query is the recommended experience for discovering, connecting to, and importing data. Power Pivot is great for modeling the data you’ve imported.
Objective: To perform advanced and complex data transformations not available in the Query Editor
Objective: Get hands-on experience with advanced administration settings, permissions, Data refresh times etc.
Objective: It complements Power Pivots and Power BI better than any other DB.
Objective: To put our entire learning to use and arrive at the best possible BI solution -using the right combination of available technologies.
Course Fee
INR 15,000 (Initial Fees)
4000 / month (for 2-months)
Note: INR 500 will get adjusted towards the Total Course Fee.
Mr. Sami, Microsoft Certified Trainer, with his qualifications in Finance, HR & Information Technology brings in 14 years of Industry experience. He has successfully trained 9500+ professionals by now, and the counting is still on.
He has undertaken assignments with the renowned IRS, The World Bank, Tata Chemicals, Buckman Laboratories, Standard Chartered, ING Barings and much more. His nature of going that Extra Mile has got him the startling popularity amongst the Excelgoodies prominent clients.


INR 12,84,448
is the annual average salary of
Data Scientist using Power BI

2,50,000
Companies have
implemented Power BI

97%
Fortune 500 Companies use
Power BI

Top Leader
in Analytics & BI for 14th
Consecutive Year.
Source:
.png)


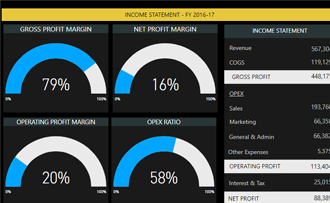
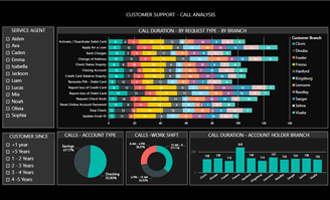
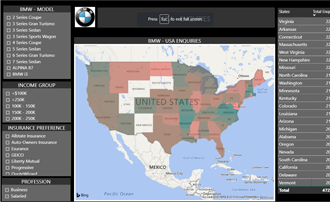
Get a full picture across data sources in seconds. Click to drill down
Get a full picture across data sources in seconds. Click to drill down
Well, the end-purpose of both tools is to help business users with high-end reporting. Where does the difference lie? The changing role of Business Users from just “receiving” the powerful…
Read More
Business intelligence (BI) reporting and automation are powerful tools that can significantly improve business processes by providing real-time insights, automating repetitive tasks, and reducing the risk of human error.
Read More
Power BI is a powerful tool for creating reports that can be accessed on desktops, tablets, and mobile devices.
Read More
Suppose you are a marketing analyst for a fast food chain, and your task is to create a data story to help the company understand the behavior of its customers
Read MoreReviews
This class was extremely helpful in my knowledge and growth in these database, analysis and reporting tools. I really enjoyed the hands-on approach and got lots of “goodies” out of all the classes. Your approach, repetitiveness and patience is much appreciated and sincerely helped...
This was a very good course where I learned high level concepts of data management (how it moves/should move) for business users, the concepts for querying and organizing data sets, the interaction and use of various tools/software, and detailed work with DAX and SQL expressions...
It was indeed some good learning! Sessions were highly informative with loaded tips here and there by Sami on remembering concepts and implementing it back at work.
I really enjoyed Assignments session which truly boosted my confidence in Automation...
Good sessions. Highly passionate trainer. Sami was quick enough to identify the skill sets and the knowledge of the participants to pace his training accordingly.
His way of simplifying the coding concepts was just spell bounding. He knew his students...
A well-structured program. The flow of training was carried out pretty well by the tutor. Enjoyed working with case studies and the concepts were taught in the simplest way
It made me much more confident to assume...
Reviews
This class was extremely helpful in my knowledge and growth in these database, analysis and reporting tools. I really enjoyed the hands-on approach and got lots of “goodies” out of all the classes. Your approach, repetitiveness and patience is much appreciated and sincerely helped...
This was a very good course where I learned high level concepts of data management (how it moves/should move) for business users, the concepts for querying and organizing data sets, the interaction and use of various tools/software, and detailed work with DAX and SQL expressions...
It was indeed some good learning! Sessions were highly informative with loaded tips here and there by Sami on remembering concepts and implementing it back at work.
I really enjoyed Assignments session which truly boosted my confidence in Automation...
Good sessions. Highly passionate trainer. Sami was quick enough to identify the skill sets and the knowledge of the participants to pace his training accordingly.
His way of simplifying the coding concepts was just spell bounding. He knew his students...
A well-structured program. The flow of training was carried out pretty well by the tutor. Enjoyed working with case studies and the concepts were taught in the simplest way
It made me much more confident to assume...

One of the best training classes attended so far. A very professional approach, well designed way of teaching. The trainer made sure that even the most slowest learner understands the concepts well. Their true intentions to make sure that everybody who attends should not complete just for the sake of completion but should understand all the concepts was very evident.
They were encouraging us to attend reclasses we dint understand any topic or wanted to learn one more time. Worthyful of the money and time spent. My special thanks and appreciations to sami sir and sai sir for their incredible teaching. Definitely would happy to recommend to others.
I am impressed with the methodology with excel goodies. It was a great learning experience for me at Excel goodies. A professional training institutions and clear road map given to students to achieve their goals.
Top class training program with step by step guidance. Had gained much knowledge in Excel VBA.! Especially Mr.Sami guided us a lot in best way. It was an very good experience with Sami and Sai. Thanks a lot to both of them. :)
I went through the VBA training here at Excelgoodies. The tutors are extremely knowledgeable and helpful. The training programme flow is well planned and helps us to scale up to doing automation in our work place. I found it very useful and it definitely helps anyone doing Excel consolidation and routine reports.
The tutors give individual focus and ensure that all students in the group have properly understood each topic. They even take the same topic again in case we do not understand. I strongly feel there is value for money for the coaching they give. At the end of the course, I could do live projects in my organisation !! Thanks to Excelgoodies :)
My overall experience at Excel Goodies was very very good - All along I used to browse the web to get a VBA Code for my requirement now and then, but the training / guidance offered at Excel Goodies by Mr.Sami and Mr.Sai has really put me in a position whereby, I can really read through the codes and understand how it works and start constructing my own.
Infact I have been looking for a Guru to teach me the fundamentals on VBA Automation for quite a long period, in order to implement my thought process on automating many of the day to day activities that are carried out at my work place and by my clients. When I was casually discussing my passion with my relative, he immediately recommended Excel Goodies to me for doing this course.
Now I am really thankful to him. I strongly recommend Excel Goodies to those who have a passion to master their Excel skills and to venture into VBA Automation, and I am planning to put my son who is a budding CMA Professional into this course. All the very best to all prospective students and Thanks to Mr.Sami & Mr.Sairam and Excel Goodies for giving me a nice learning experience.
Excelgoodies surprises me on how well they cater their programs so perfectly structured and carried out. Cannot ask for better. The programs very well co-ordinated and tailor-tweaked along the course to ensure the best is delivered. Strongly recommend excelgoodies!
Awesome and Structured well professionalled Centre I have seen so far.. the way they organized each sessions was fantastic. I'm very impressed with the vision you guys having against the training program..
Mr.Sami and Mr.Sai thank you so much for your time and patience with us..I'm lucky that I had completed my course in 2019 and starting 2020 with the pride of learning from Excelgoodies.. Rock On - All the best to the team.
I have taken up the VB course during Jan 2019 in ExcelGoodies(EG) - I will strongly recommend Working Professional/Finance Students to take it up the course here in ExcelGoodies. EG is highly professional in terms of conducting trainings, coaching and guiding people in right direction.
My Special kudos to Sami/Sai sir for the wonderful coaching style/techniques followed throughout the 3 months course. Until i joined the course i felt like VB is coding language which Non-Engineering students cannot understand but Sami sir break the assumption and made it clear that anyone can learn VB if they really aspire to learn it.
Thanks once again !!!! Looking forward to opt many course in future in EG (Ex: Power BI, Advance Excel Techniques etc).
My training experience was good... Both the trainers are very knowledgeable as well as very kind... I am a commerce graduate but they have trained me very well with my small amount of excel knowledge.... Whenever I asked coding related clarifications, they helped me immediately... Thanks to Sai and Sami sir..
Mr. Sami/Sai I believe that you have great mastery and expertise in Excel and VBA automation. You have an art in breaking up complex principles into simple and understandable teaching methods.
Excelgoodies has enhanced my skills and taken me to a all new level. I trust you will support me in completing my project. I would surely refer this institute to my colleagues.
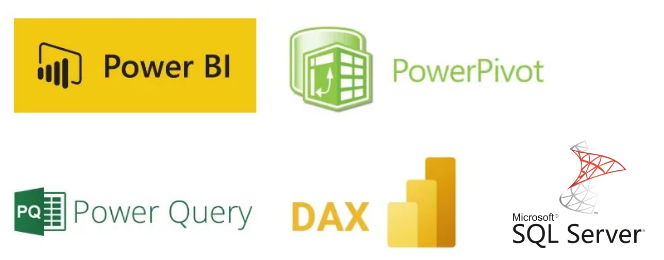
You will learn to use the right and hybrid technology for end-to-end advanced power reporting.
Tools: Power BI, Power Pivot, VBA, Excel,
M-Programming, MS-SQL, SSIS, and many more.

Power BI

Micorsoft T-SQL
MS-SQL Integrated Services

Python

Microsoft Excel VBA

MS-Excel

Power Query